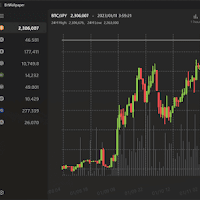
Ever wondered about those funky charts with green and red bars you see in the world of stocks and cryptocurrencies? They’re called “candlestick charts”, and they’re not as complicated as they look!
Imagine each bar, or “candlestick”, as a little story of a cryptocurrency’s journey in a specific time interval. Each candlestick tells us four things: the high, low, open, and close values of a cryptocurrency.
If our little candlestick ends its journey higher than where it started (the closing value is higher than the opening), it turns green. If it had a tough day and ended lower than it started (the closing value is lower than the opening), it turns red.
Just by glancing at the colors, you can get a sense of whether your shares or cryptocurrencies are having a good day (going up) or a bad day (coming down).
Now, if you’re a cryptocurrency investor, or just curious, you might want to track these values daily.
But how? Meet BitWallpaper, an open-source app that’s here to help. And no, despite the “wallpaper” in its name, it’s not about changing your desktop background!
BitWallpaper is available for Windows, and you can download it from its GitHub website or the Microsoft App Store. And don’t worry, the developer promises that this app doesn’t collect any information from its usage.
Once you open BitWallpaper, you’ll see cryptocurrency values displayed in Japanese Yen.
It supports a variety of cryptocurrencies, including the big names like Bitcoin, Litecoin, Ethereum, and 21 others.
In the BitWallpaper interface, you can pick your cryptocurrency of interest from the sidebar.
Voila! You’ll see the candlestick chart for that currency. You can even choose the chart intervals, from as short as 1 minute to as long as several months. If you’re into short-term investment, go for shorter intervals. If you’re in for the long haul, longer intervals are your friend.
Ready to dive in? You can download BitWallpaper from its official GitHub page. https://github.com/torum/BitWallpaper
Happy investing!

